A car break-in is a theft of something from inside a parked vehicle. In 2025 police reported 698,347 thefts from vehicles to the FBI. That is one every 45 seconds. Most thefts never reach that count, and a few states send the FBI incomplete data, so read the state table below with both in mind.
Key takeaways
- In 2025 police reported 698,347 thefts from vehicles to the FBI. That is one every 45 seconds.
- Reported thefts from vehicles fell from 883,671 in 2022 to 698,347 in 2025, even as FBI coverage rose from about 81% to about 89% of the population.
- Texas had the highest reported rate of any state in 2025, 354.8 per 100,000 people. Washington, D.C. was higher still, at 689.4.
- Only about 1 in 4 thefts is ever reported to police (Bureau of Justice Statistics, 2024), so every number here is a floor.
Want to see your own state on a map? Pick it on our interactive car break-in map and watch the numbers run. The full state-by-state table is below.
Car break-in statistics come down to one number, and it is the one above. Below are the rate and count for every state. For the thief's side, see how thieves pick a car.
How often are cars broken into? Once every 45 seconds, reported
In 2025 police reported 698,347 thefts from vehicles to the FBI, according to the FBI's Crime Data Explorer. That is one every 45 seconds, all day, all year. In the areas whose police reported, it works out to 228.1 thefts for every 100,000 people.
The FBI's category is Theft From Motor Vehicle: things taken from inside a car. A stolen car is a different crime, counted separately. So are stolen parts and accessories, which added another 191,103 reports in 2025.
The trend is down, and the drop is real
Reported thefts from vehicles fell from 883,671 in 2022 to 698,347 in 2025. Over the same years, the share of Americans covered by police agencies reporting to the FBI's incident system rose from about 81% to about 89%. More of the country was counted, and the count still fell.
What the police number leaves out
Most thefts never reach the count. Only about 1 in 4 thefts is ever reported to police, according to the Bureau of Justice Statistics National Crime Victimization Survey for 2024. That survey's category is "other theft", which is wider than thefts from cars, so read it as a direction, not a multiplier.
Of the thefts that are reported, fewer than 1 in 20 is cleared by police (FBI, 2025).
We tried the tools people suggested. The results are on film.
Car break-in statistics by state, 2025
The table gives each state's reported thefts from vehicles in 2025 and the rate per 100,000 residents. The same figures drive the break-in map on our home page. How to read it:
- Use the rate to compare states. It is the FBI's method: thefts per 100,000 people living where police reported. The count tells you volume, which mostly tracks population.
- Counts are reported thefts, not a state total. They come from police agencies that send data to the FBI. The FBI publishes no state estimate for this offense.
- * Six states use the FBI's second series. In Alaska, Arizona, California, New Jersey, New York and Pennsylvania, the FBI's incident system covered less than 85% of residents in 2025. Their rows use the FBI's supplemental larceny data ("From Auto"), which covered at least 97% of residents there.
- † Florida, Louisiana and Mississippi are incomplete in both FBI series. Their figures are shown for completeness. Do not read them as low.
- Police agencies classify incidents differently, so treat states with close rates as roughly equal.
| State | Per 100,000 | Reported thefts | Population covered |
|---|---|---|---|
| Alabama | 147.5 | 7,604 | 99% |
| Alaska * | 300.3 | 2,206 | 100% |
| Arizona * | 182.9 | 13,641 | 98% |
| Arkansas | 164.0 | 5,030 | 98% |
| California * | 298.7 | 117,508 | 100% |
| Colorado | 314.6 | 18,754 | 99% |
| Connecticut | 139.5 | 5,147 | 100% |
| Delaware | 206.2 | 2,186 | 100% |
| District of Columbia | 689.4 | 4,782 | 100% |
| Florida † | 170.8 | 29,304 | 73% |
| Georgia | 276.3 | 28,292 | 90% |
| Hawaii | 223.3 | 3,200 | 100% |
| Idaho | 79.9 | 1,601 | 99% |
| Illinois | 160.8 | 19,364 | 95% |
| Indiana | 162.4 | 9,919 | 88% |
| Iowa | 141.1 | 4,434 | 97% |
| Kansas | 259.7 | 7,326 | 95% |
| Kentucky | 168.1 | 7,745 | 100% |
| Louisiana † | 171.1 | 6,161 | 78% |
| Maine | 86.0 | 1,200 | 99% |
| Maryland | 295.6 | 18,522 | 100% |
| Massachusetts | 117.7 | 8,400 | 100% |
| Michigan | 168.5 | 16,526 | 97% |
| Minnesota | 219.8 | 12,790 | 100% |
| Mississippi † | 160.0 | 3,850 | 82% |
| Missouri | 237.8 | 14,717 | 99% |
| Montana | 183.0 | 2,095 | 100% |
| Nebraska | 192.9 | 3,871 | 99% |
| Nevada | 295.3 | 9,659 | 100% |
| New Hampshire | 76.0 | 1,075 | 100% |
| New Jersey * | 149.0 | 13,881 | 98% |
| New Mexico | 324.9 | 6,485 | 94% |
| New York * | 103.8 | 20,501 | 99% |
| North Carolina | 312.5 | 33,807 | 97% |
| North Dakota | 144.6 | 1,142 | 99% |
| Ohio | 181.3 | 20,102 | 93% |
| Oklahoma | 259.2 | 10,678 | 100% |
| Oregon | 322.0 | 13,489 | 98% |
| Pennsylvania * | 145.1 | 18,798 | 99% |
| Rhode Island | 131.7 | 1,447 | 99% |
| South Carolina | 291.0 | 15,611 | 96% |
| South Dakota | 161.1 | 1,352 | 90% |
| Tennessee | 280.2 | 20,420 | 100% |
| Texas | 354.8 | 111,526 | 99% |
| Utah | 227.3 | 7,958 | 99% |
| Vermont | 283.8 | 1,825 | 100% |
| Virginia | 196.8 | 17,475 | 100% |
| Washington | 329.5 | 25,714 | 98% |
| West Virginia | 71.0 | 1,096 | 87% |
| Wisconsin | 105.6 | 6,126 | 97% |
| Wyoming | 127.9 | 695 | 92% |
Source: FBI Crime Data Explorer, Theft From Motor Vehicle (NIBRS), 2025, and FBI supplemental larceny data for rows marked *. Data refresh of Sep 15, 2026, read Sep 19, 2026. The FBI revises these figures in later refreshes, so the live site can differ slightly.
Highest and lowest rates
The highest reported rates among states were Texas (354.8 per 100,000), Washington (329.5), New Mexico (324.9), Oregon (322.0) and Colorado (314.6). Washington, D.C., a single city, was 689.4. The lowest were West Virginia (71.0, with 87% coverage), New Hampshire (76.0), Idaho (79.9) and Maine (86.0). Florida, Louisiana and Mississippi are left out of both lists because their reporting is incomplete.
By count, California (117,508) and Texas (111,526) reported the most, which says more about their size than their streets.
What a smash-and-grab car break-in costs
A smash-and-grab is the fast version of a car break-in: a window broken, something taken from the seat or the floor, the thief gone. The FBI's figures do not record how a thief got into the car, so there is no national count of smash-and-grabs. There is a price, though.
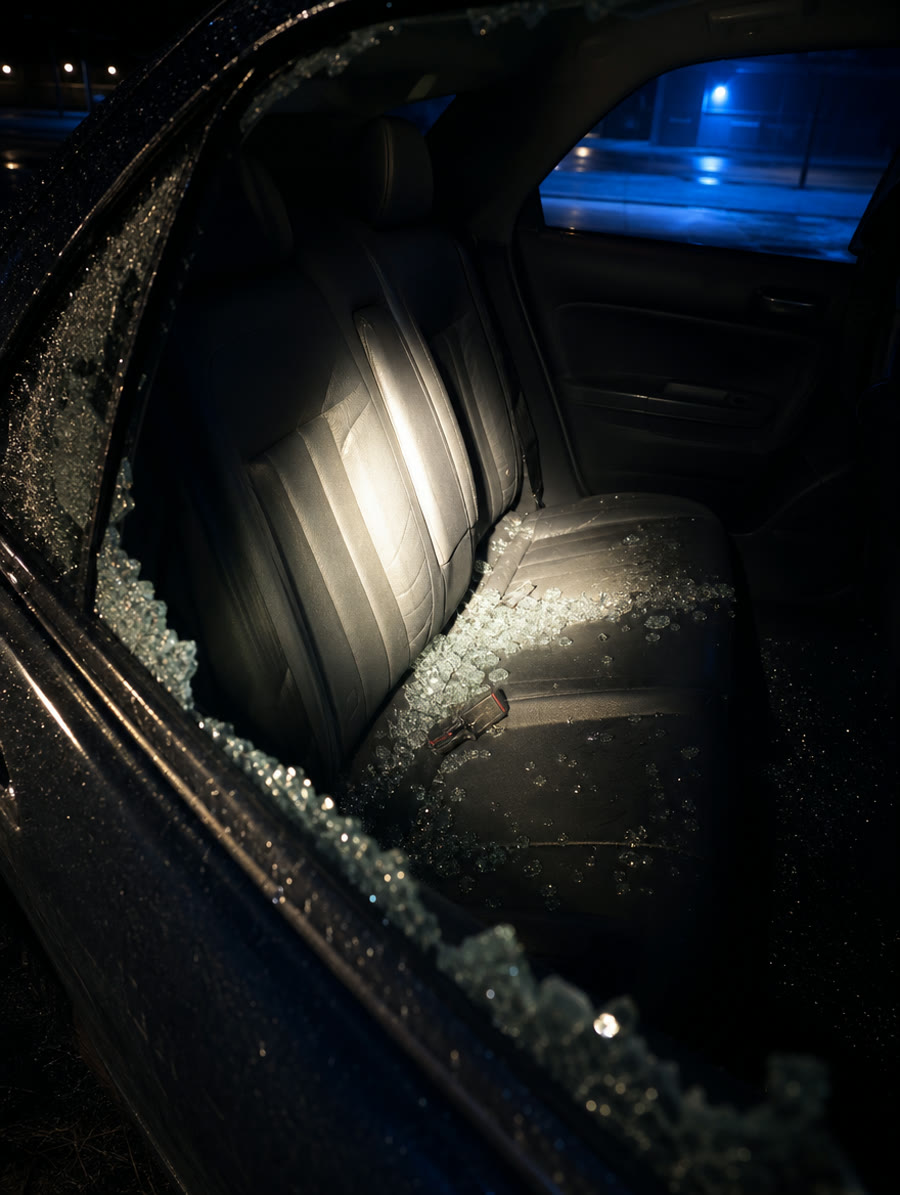
The average theft from a vehicle costs the owner about $1,500 in stolen property (FBI, 2025), before the broken window. It is an average, and a few large losses pull it up.
Guns are part of it. Cars are now the largest source of stolen guns. Nearly 62,000 guns were reported stolen from vehicles in 2022 in the 337 cities studied, one every nine minutes, according to Everytown Research. That is not a national total. Firearms are stored unloaded. The detail is in gun theft from cars, the data.
Episode 2 of our Smash and Grab series tours the glove box, the console and under the seat, for laughs. It is also the list of what to empty.
What the numbers do not tell you
Car break-in statistics at state level are an average across cities, suburbs and empty highway. The block where you park can be very different. Some large cities, including San Francisco, Oakland and New Orleans, did not send incident data for all of 2025, which is why we do not rank cities here.
These are things stolen from cars. Whole cars stolen are a separate count, and the NICB's vehicle theft hot spots list covers those.
What to do after a car break-in
- Photograph it before you touch it. The window, the seats, what is missing.
- Report it to the police. Only about 1 in 4 thefts is ever reported, and an insurer will usually want the report number. Many departments take these online.
- Cancel what can be cancelled. Cards, then any key, garage opener or device that can be locked remotely.
- Call your insurers, plural. The Insurance Information Institute says renters policies generally protect property stolen from your car, under off-premises coverage, and that the HO-3 homeowners policy covers personal property anywhere in the world. The broken window is a car insurance question. Limits and deductibles vary, so check your own policy.
- If a firearm was taken, report it right away. What to do if your gun is stolen from your car has the steps.
What we would do
The cheapest fix is an empty car. Take what you can with you, and put away what you can't before you park, not in the lot.
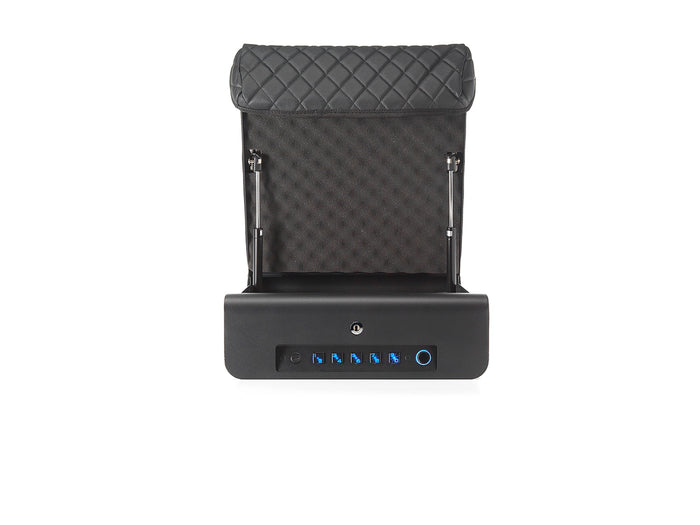
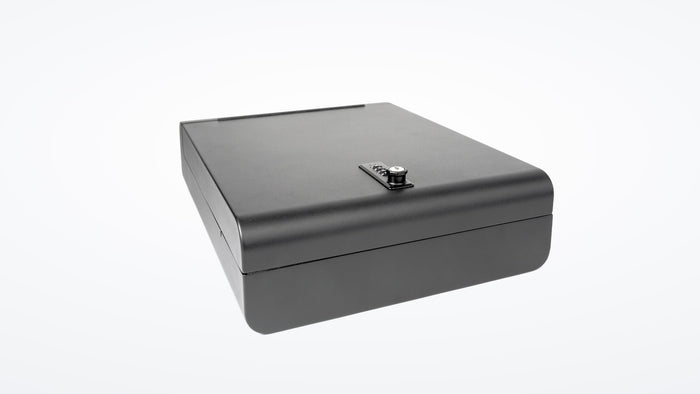
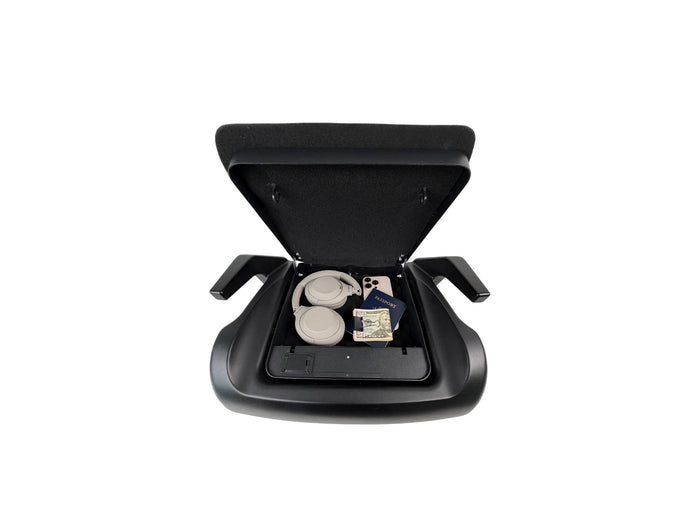
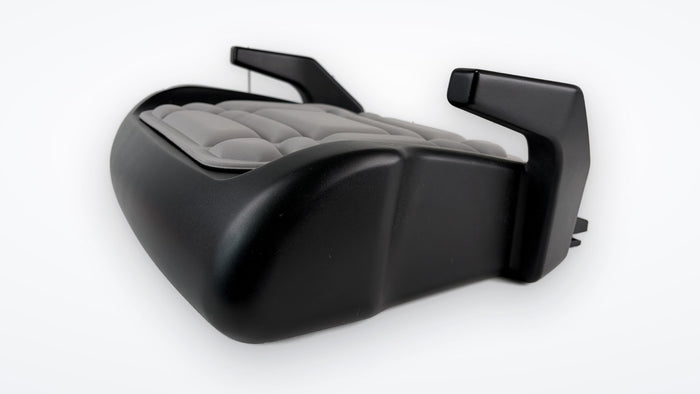
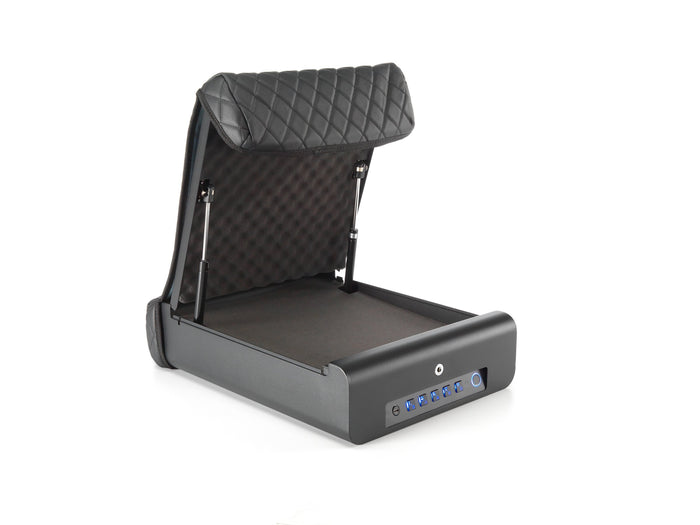
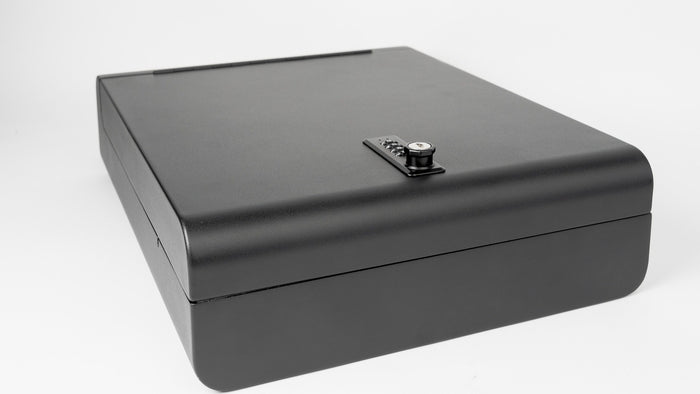
For what has to stay, use a locked steel box fixed to the car. That is what the Boosted Safe Elite is for. Boosted Safe is a steel car safe that clips to your car's LATCH anchors (called ISOFIX outside the US), the steel bars welded to the car's body to hold a child seat. The release is inside the safe. It comes off the anchors only after it has been opened.
The Elite is 16-gauge steel and fits a 16-inch MacBook Pro. It opens with your finger, a code or a key. It will not fit a tripod or anything longer than 15 inches. It does not stop a window from being smashed. With enough time and tools nothing is secure. The job is to raise the time and the tool count.
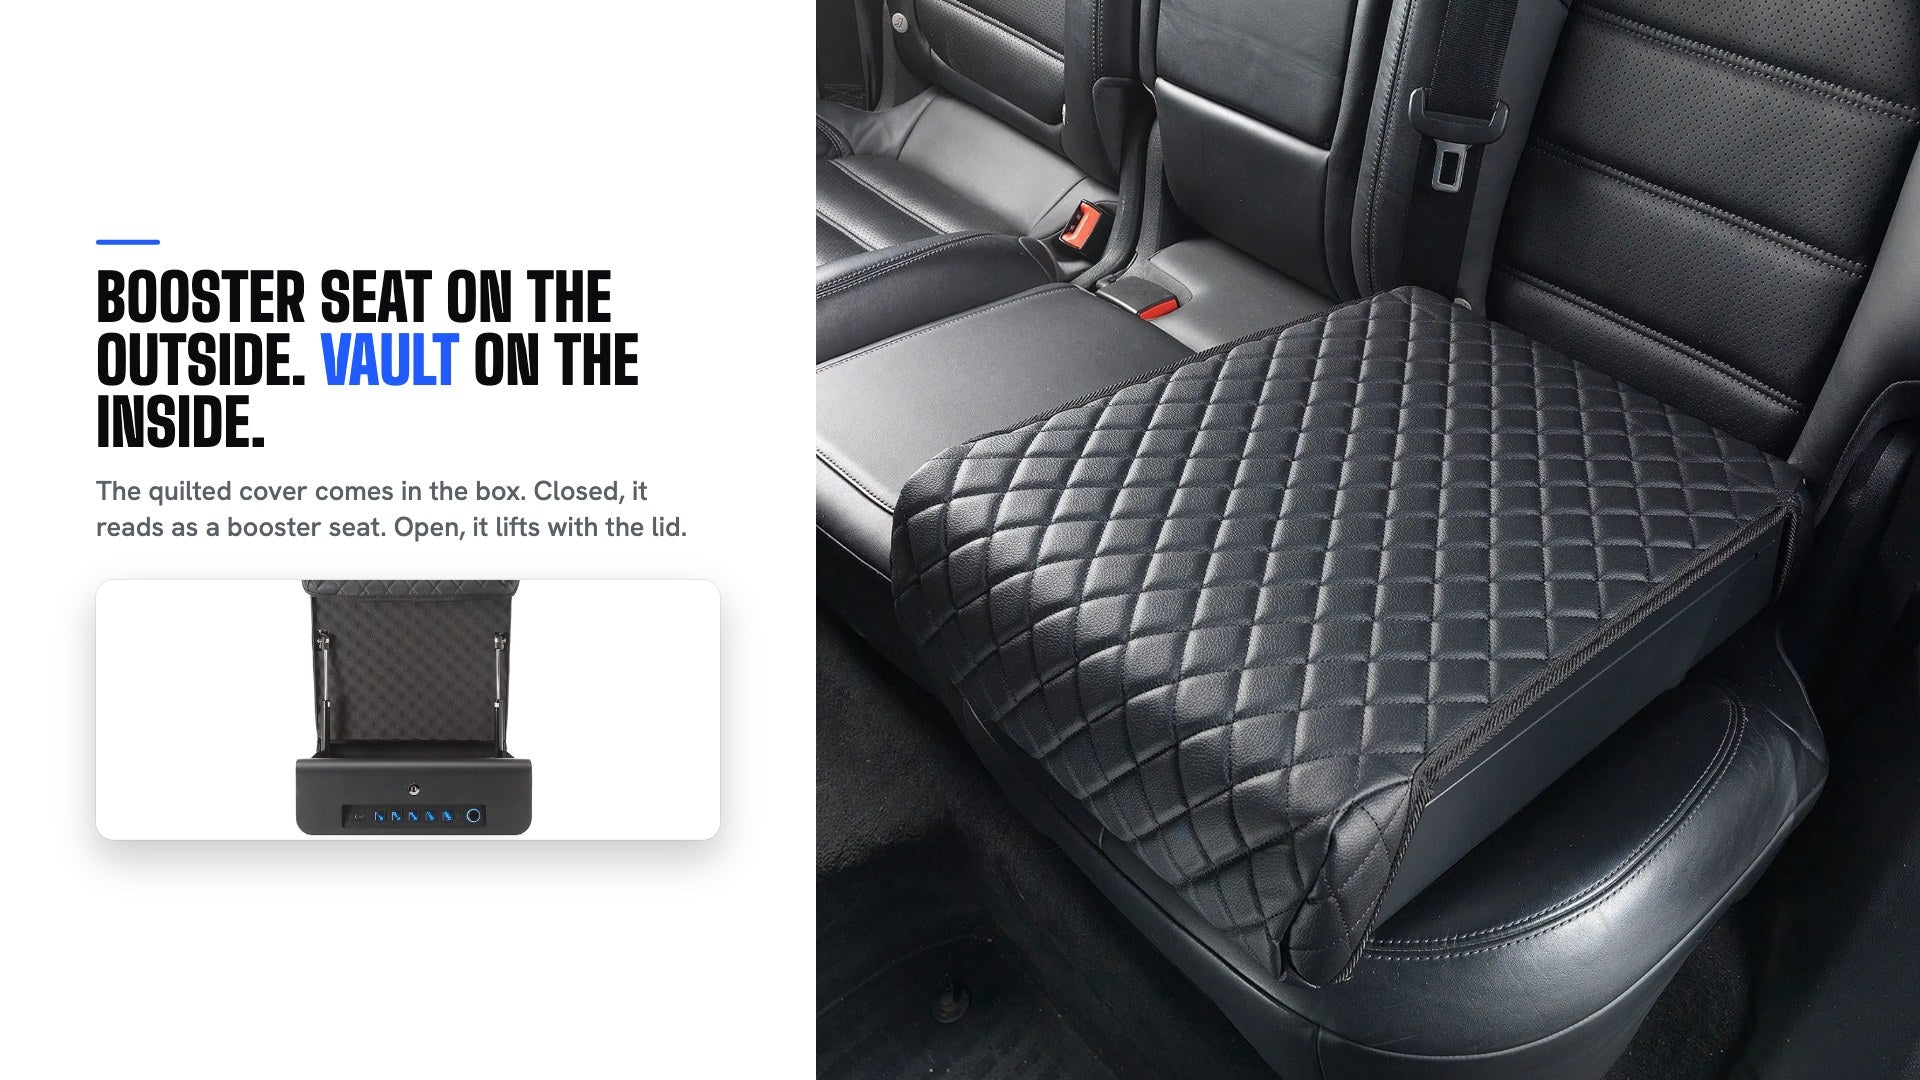
The anchors are in US passenger vehicles from model year 2003. Heavy trucks and some two-seat vehicles can be exceptions, so check your vehicle first. Every safe comes with a 30-day money back, a lifetime warranty and a break-in replacement guarantee (warranty and guarantee). For what to lock up and where, see securing a laptop, camera and passport in the car.
Boosted Safe Elite
Steel, latched to the car, opened with your finger.
Questions
How often are cars broken into in the US?
Police reported 698,347 thefts from vehicles to the FBI in 2025, one every 45 seconds. That covers only agencies that send incident data to the FBI, about 89% of the population. Only about 1 in 4 thefts is ever reported to police (BJS, 2024), so the real number is higher than the count.
Which state has the most car break-ins?
By rate, Texas had the highest reported rate of any state in 2025: 354.8 thefts from vehicles per 100,000 people. Washington, D.C. was higher at 689.4. By count, California (117,508) and Texas (111,526) reported the most. Florida, Louisiana and Mississippi sent incomplete data, so their places in any ranking are uncertain.
Are car break-ins going up or down?
Down, in the reported numbers. Thefts from vehicles reported to the FBI fell from 883,671 in 2022 to 698,347 in 2025. Over the same years the share of the population covered by reporting agencies rose from about 81% to about 89%. More of the country was counted, and the count still fell.
What is a smash-and-grab car break-in?
It is a theft where someone breaks a car window, takes what is in view and leaves. The FBI's figures do not record how a thief got in, so there is no national count of smash-and-grabs. Replacing a side window typically runs $150 to $450 (iSeeCars), on top of an average loss of about $1,500 in stolen property (FBI, 2025).
Keep reading
- Do car gun safes stop thieves: what a vehicle safe does and does not do.
- What cutters do to a cable: why a box on a cable is the weak point.
Sources
- FBI, Crime Data Explorer, NIBRS Theft From Motor Vehicle (23F), national and by state, 2025, with 2022 to 2024 for the trend, clearances and Theft of Motor Vehicle Parts or Accessories (23G). Data refresh Sep 15, 2026, read Sep 19, 2026. Agencies covering about 89% of the US population. FBI's Crime Data Explorer
- FBI, Crime Data Explorer, supplemental larceny data, "From Auto" counts for Alaska, Arizona, California, New Jersey, New York and Pennsylvania, and average stolen value, 2025. Read Sep 19, 2026. cde.ucr.cjis.gov
- Insurance Information Institute, "Your renters insurance guide" and "Am I Covered?", read Nov 1, 2026. iii.org
- Bureau of Justice Statistics, Criminal Victimization, 2024 (NCJ 310547), Table 4, Sep 29, 2025. Bureau of Justice Statistics
- iSeeCars, "How Much Does It Cost to Replace a Car Window?" iSeeCars
- Everytown Research, "Gun Thefts from Cars: The Largest Source of Stolen Guns", May 9, 2024. Everytown Research